Logchecker
Threat intelligence is one of the most critical weapons we can use in cyber defense. I often use Threat intelligence for enhancing my daily tasks in LIFARS such as incident response, threat hunting, forensics and malware analysis. And because the automation is the key for many tasks, I decided to design a new tool which helps us to speedup our processes. Our great R&D team then developed this tool and we recently released under Open Source MIT License as our gift to the community.
Introduction
In this post, I would like to briefly introduce our new Logchecker tool and its usage.

As we stated in our Knowledge Center, Logchecker is “Windows and Linux tool for scanning log files, developed by LIFARS. It extracts IP addresses, domain names and hashes from input file and checks for them in Threat Intelligence database. It supports Windows EVTX logs, text-based logs or any plaintext files. Output can be in CSV format for better human readability or in JSON for computer processing.”
We can simply use the Logchecker for checking log files for occurrences of known-bad observables such as IP addresses. Just imagine that we need to review access logs from webserver, or Linux auth logs. Usually we want to find if there were any connections originated from the IP address already reported as malicious or suspicious. With Logchecker, this task is now very easy - it automatically extracts all IP addresses and checks them in the Threat Intelligence platform called YETI.
YETI
YETI stands for Your Everyday Threat Intelligence, and it is great Open Source Threat Intelligence platform. It “organizes observables, indicators of compromise, TTPs, and knowledge on threats in a single, unified repository” and can also automatically enrich collected observables using its analytics. It has Web UI and also web API, which is used by our Logchecker. Thanks to the pyeti, Python bindings for YETI’s API.
Logchecker installation
Logchecker requires Python 3, and there are several ways how we can install it - they are documented in its GitHub repository in README file. We have these options:
- Install Logchecker using setup.py
- Install Logchecker using pip
- Use Logchecker without installation
The most easy way is to install Logchecker with pip. In addition, it also create a simple script called logchecker which could be executed from the commandline. It can be installed with the following one-liner:
pip3 install git+https://github.com/yeti-platform/pyeti git+https://github.com/Lifars/log-checker.git
However, if we would like to test without affecting the rest of your system, we can do it in virtual environment:
python3 -m venv test
cd test
source bin/activate
pip3 install git+https://github.com/yeti-platform/pyeti git+https://github.com/Lifars/log-checker.git
Logchecker usage
Now, Logchecker should be installed, and we can verify it by execute this tool and display its help.
$ logchecker -h
usage: logchecker [-h] [-c CONFIG] -f FILE [-o OUTPUT] [-a] [-d] [-H] [-A]
                  [-C | -j] [-u URL] [-k KEY]

optional arguments:
  -h, --help            show this help message and exit
  -c CONFIG, --config CONFIG
                        Config file path. Config file should contain url of
                        YETI database, authorization key and output format. If
                        it is present, it overrides --url, --key and
                        --csv/--json options.
  -f FILE, --file FILE  [REQUIRED] Log file path.
  -o OUTPUT, --output OUTPUT
                        Output file path. If file does not exist, creates new
                        file.If not specified, output is printed to STDOUT.
  -a, --address         Search only for ip addresses. If none of the address,
                        domain or hash flag is specified, it search for all
                        mentioned.
  -d, --domain          Search only for domains. If none of the address,
                        domain or hash flag is specified, it search for all
                        mentioned.
  -H, --hash            Search only for hashes. If none of the address, domain
                        or hash flag is specified, it search for all
                        mentioned.
  -A, --all             Show all values in logs. By default it shows only
                        values which have record in database.
  -C, --csv             Output in CSV format. This is default option.
  -j, --json            Output in JSON format. By default output is in CSV
                        format.
  -u URL, --url URL     URL of YETI instance.
  -k KEY, --key KEY     API key for YETI.
We have several options for affecting what types of observables are extracted. We can also choose output format: CSV or JSON. We need to also provide Logchecker with the URL of YETI instance and YETI API key. It is possible to set all of these options in config file and use it instead of the CLI arguments. And last, but not least, we have to provide log file which we wanted to check with -f option. Remember, it could be any plaintext file or Windows event log file in EVTX format.
Here is an example of config file:
[DEFAULT]
url = https://yeti.example.org/api
api_key = <YETI API KEY>
output_format = csv
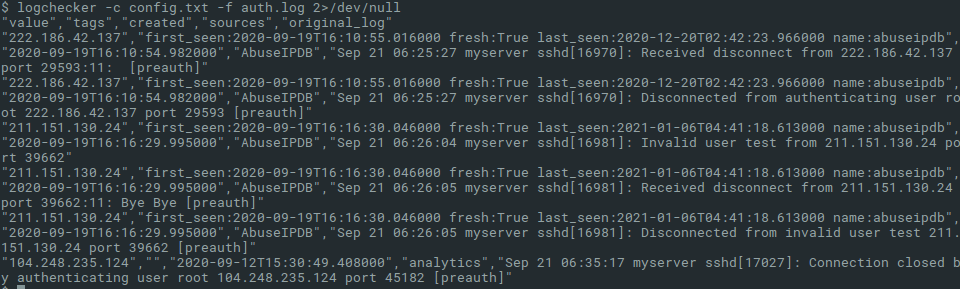
When Logchecker is executed, it outputs some information messages about its progress into stderr, thus we can simply filter them out with redirecting the stderr to /dev/null on Linux machines. Or we can save results into the output file specified with the option -o.
Conclusion
I can now automate my daily tasks related to review observables - either during forensic analysis of log files, or during threat hunting or incident response in large environments. But remember, for benefit from the Logchecker, we need to have installed YETI instance and collect observables from good feeds relevant for our context, and we need to understand what the results mean. The Logchecker is tool made by analysts for analysts.